Main stories
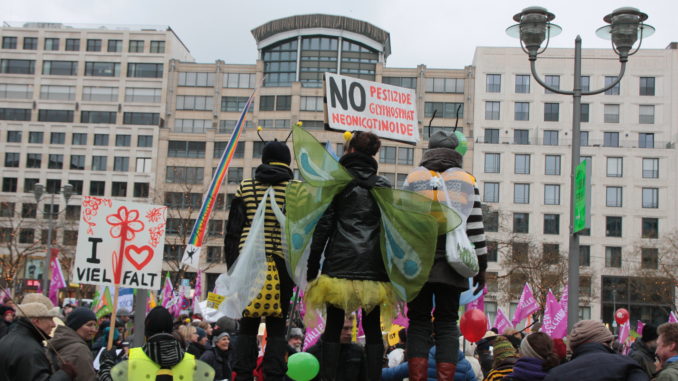
We Are Fed Up – & we showed it!
Thousands of farmers, activists and concerned citizens converged on Berlin on Saturday to say – once again – We Are Fed Up with agro-industry! […]

Thousands of farmers, activists and concerned citizens converged on Berlin on Saturday to say – once again – We Are Fed Up with agro-industry! […]

It is high time that our food movement connects with cross-cutting issues that will define the future we want. Pavlos Georgiadis analyses the intersectional, cross-cutting rights issues that brought him to Berlin for Wir Haben Es Satt […]
What are the different political parties’ positions – in Germany and at EU level – likely to be regarding CAP reform? with Sebastian Lanker. […]
EU farm incomes are down, but are plummeting in European powerhouse economy Germany. […]
NewsFlash July 2015 […]
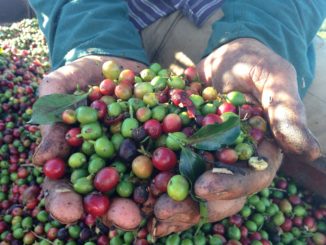
the weather extremes which accompany climate change are changing how coffee is grown […]

Make democracy, solidarity and sustainability work for us […]

[show-map id=’1′]We reveal just how fair and green CAP 2014-2020 really is.
In the CAP reform deal agreed in June 2013, both Council and Parliament have supported greater flexibilities for implementing Pillar 1 new direct payment schemes. As a result for some, the CAP would seem to be less “common” and be more “à la carte”. However, since the 2003 reform had already introduced a phasing-in agenda for decoupled payments, CAP is already implemented through differentiated schemes among the MS. With the 2013 reform, many new schemes aiming at improving the direct aids targeting are mandatory (greening, young farmers) while other are facultative (i.e. optional) (coupled payments, payments for areas with natural constraints, small farmers scheme). Only their implementation modalities can be adjusted: upsizing or at the contrary downsizing the redistribution of CAP money among farmers according to national/regional priorities. Whether the CAP reform has been decided by 28 Member States (MS) and the European Parliament, it will been applied within 32 EU territorial constituencies. In the UK, regional jurisdictions will apply the CAP reform according to their distinctive boundaries in Northern Ireland, Scotland, Wales and England. […]
Analysing CAP expenditure provides a great opportunity for civil society organisations to assess whether CAP will really be, as was promised, greener and fairer. Here on CAPWatch, we will give you the facts and provide our own analysis. So CAPWatch will step behind the basic stats and the spin, and, using our own specially developed metrics, reveal just how fair and green CAP 2014-2020 is.[show-map id=’1′] For more details click on the member stateThe details used here will mainly be ex-post expenses, based on the financial reports provided by the European Commission and data provided by EuroStat. Expenditures are annually published by the European Union: this gives us the chance to make analyses and comparisons on a quantitative basis. This then allows for the calculation of very simple and useful indicators, such as percentages, monetary values of expenditure per Member State (MS), per hectare, for specific policy objectives etc.) to figure out the way CAP money is spent on land, per worker*, per value added and per rural development priority. These calculations will highlight the real weight of […]

Arc2020, Friends of the Earth Europe & IFOAM EU showcase 10 farming best practice case studies […]
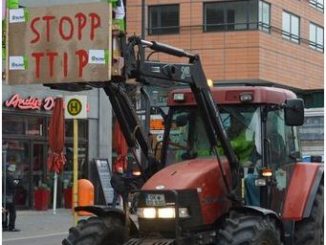
Karen Hansen-Kuhn & Hannes Lorenzen unpack the issues with TTIP & local food names in this long read. […]

Soup&Talk and The Transatlantic – European workshop on TTIP after the “We are fed up!” demo 17.01.2015 in Berlin […]
Our correspondent in Greece Myrto Pispini takes a closer look at this shocking case […]
Agricultural and Rural Convention